The Click Data Revolution: How Smart Marketers Turn Heatmap Insights Into Conversion Gold
Find out how FERMÀT’s heatmaps uses real-time intelligence to personalize, optimize, and scale ecommerce funnels for higher conversions.
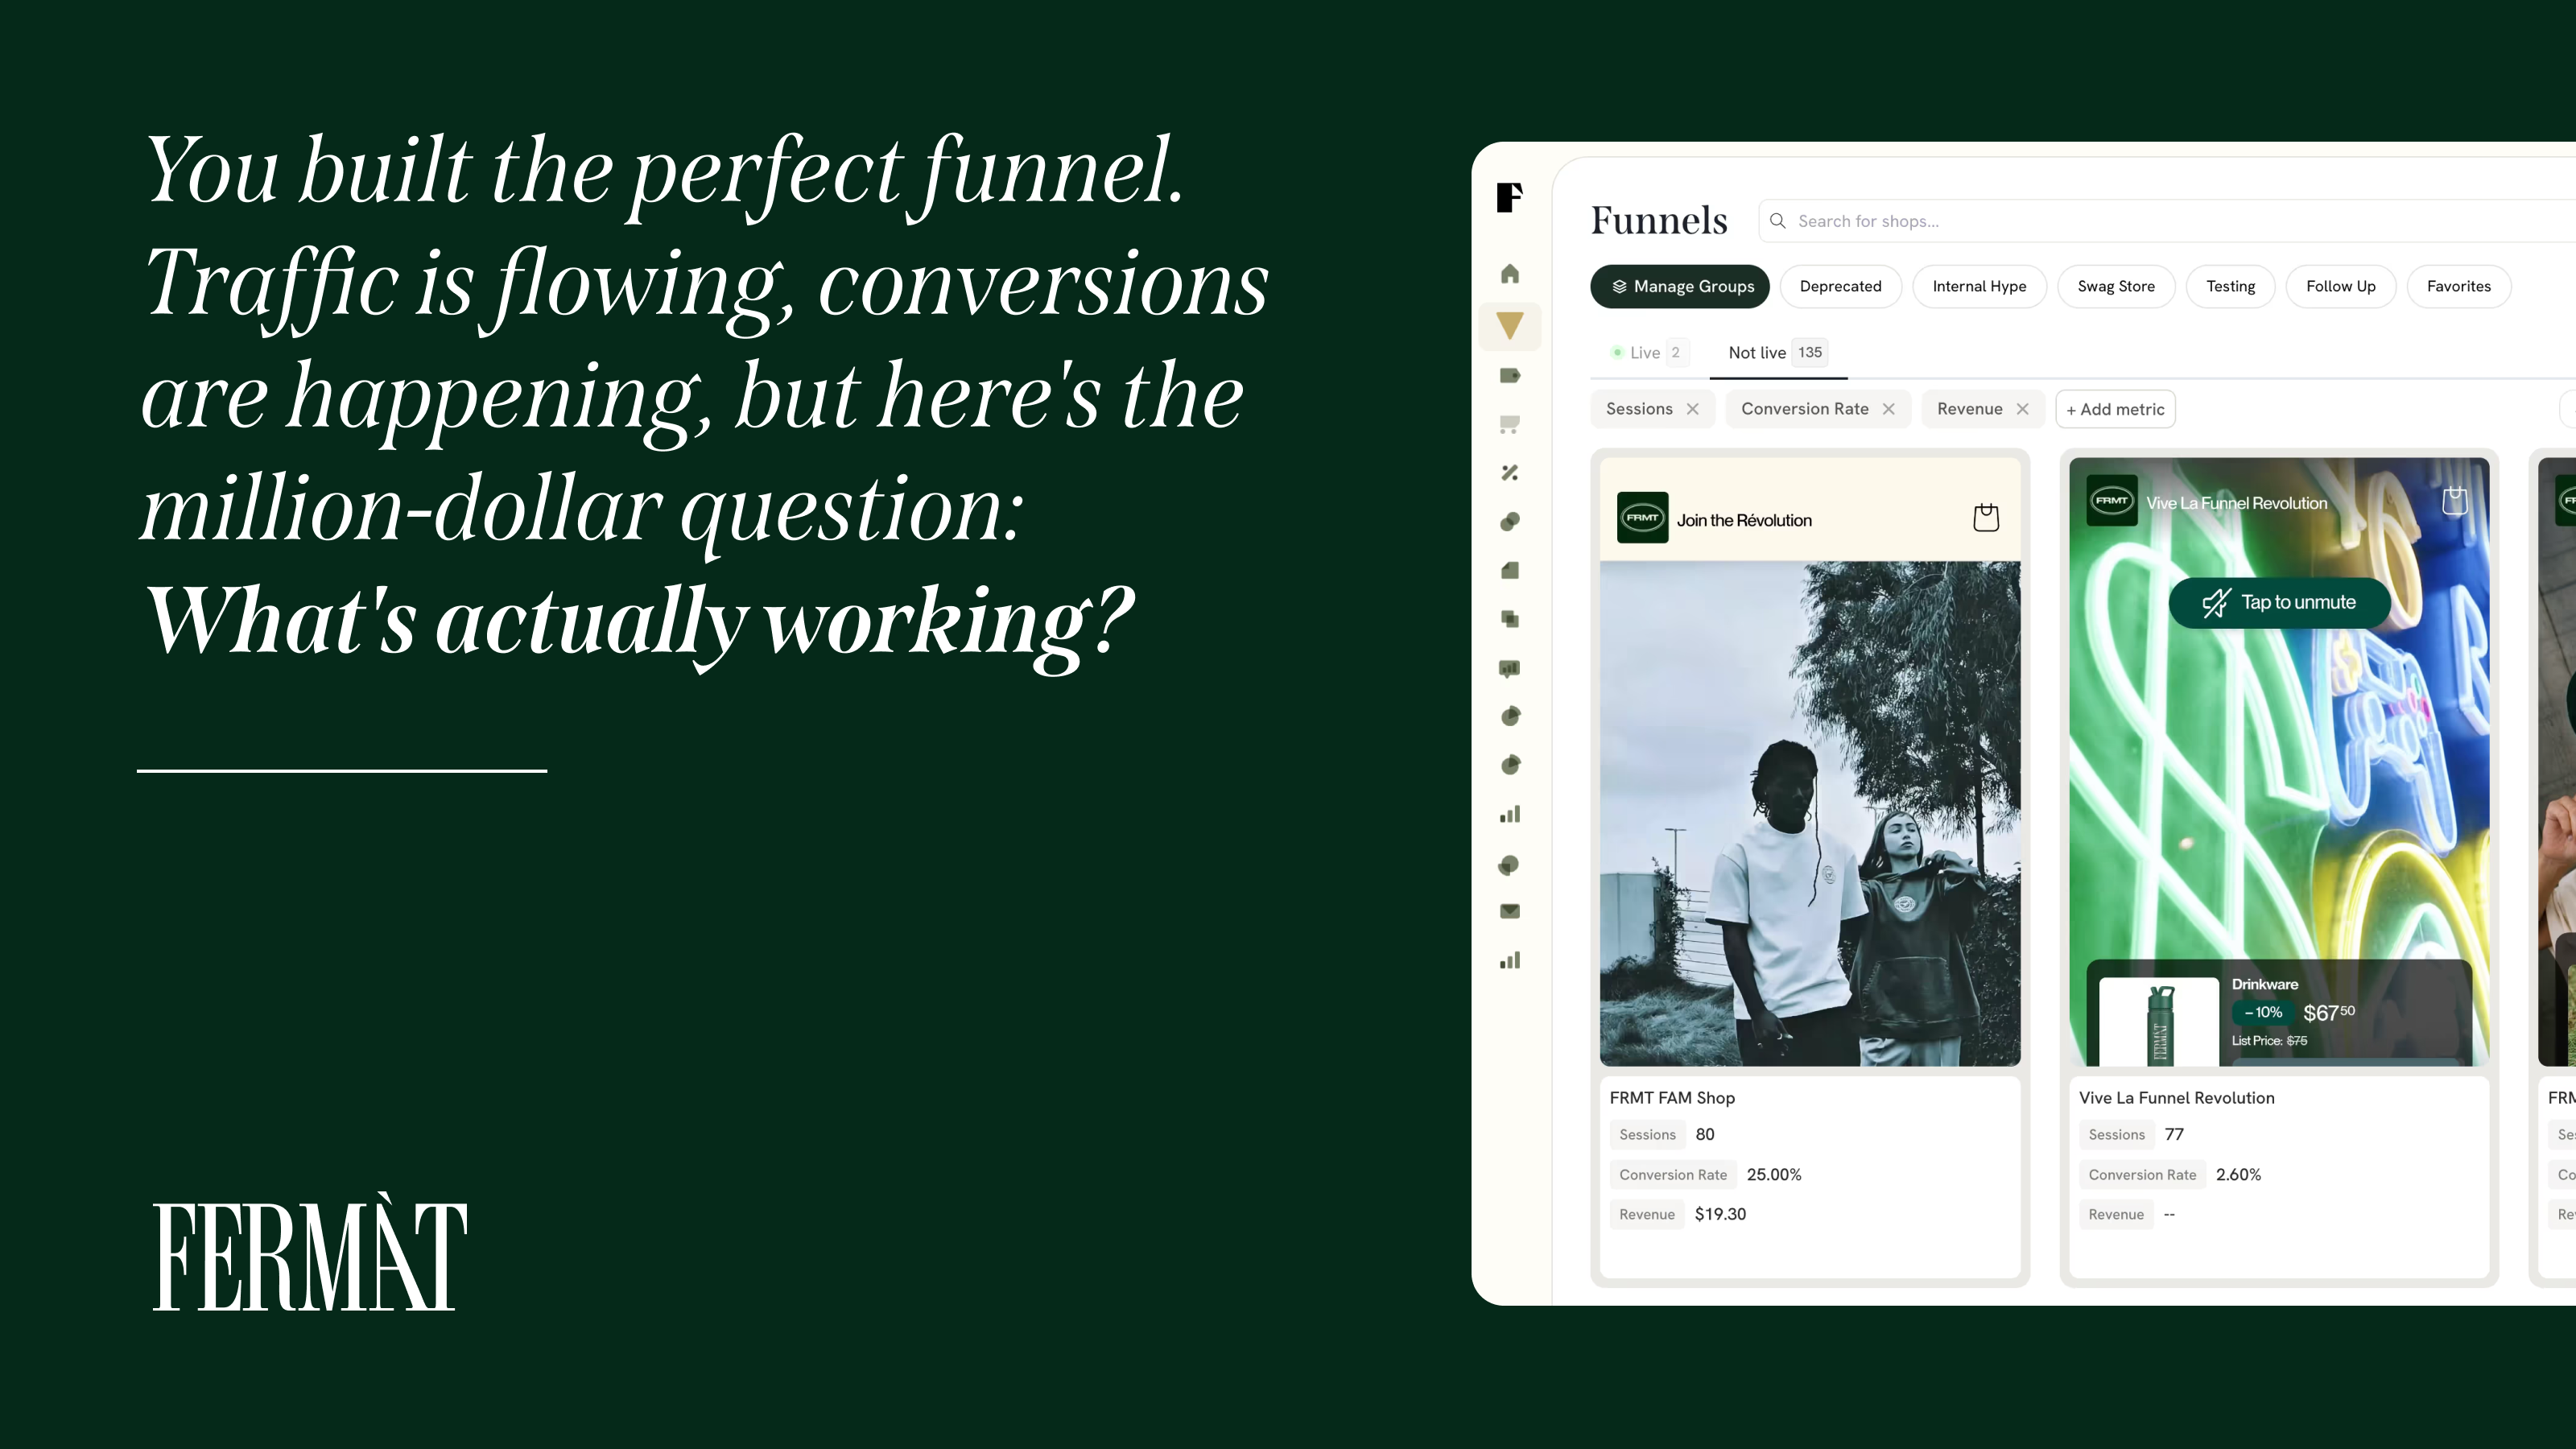
You built the perfect funnel. Every element carefully crafted, every CTA strategically placed, every product module positioned for maximum impact. Traffic is flowing, conversions are happening, but here's the million-dollar question: What's actually working?
Most ecommerce marketers are flying blind. They know their conversion rates, they track their revenue, but they have no idea which parts of their funnels are conversion magnets and which are dead zones. It's like running a restaurant without knowing which dishes customers actually order.
But what if you could see exactly where every visitor clicks, which product images draw attention, and which CTAs get ignored? What if you could turn invisible user behavior into actionable optimization insights that directly impact your bottom line?
This is exactly where heatmap analytics come in.
The Hidden Conversion Killers Lurking in Your Funnel
Every day, thousands of potential customers land on your carefully designed product pages and funnels. They scroll, they browse, they consider—and then they leave. Traditional analytics tell you they bounced, but they don't tell you why.
Was it the product image that failed to capture attention? The CTA button that blended into the background? The pricing section that felt overwhelming? The product description that didn't resonate? Without understanding the micro-interactions that drive macro-conversions, you're optimizing in the dark. The difference between success and missed opportunity often lies in these invisible behavioral patterns.
What Click Data Reveals About Your Customers
Click data is the digital equivalent of watching customers navigate a physical store. It shows you where they pause, what catches their eye, and where they lose interest. But unlike traditional heat mapping tools that show generic patterns, modern click analytics reveal the specific story of how customers interact with your unique funnel elements.
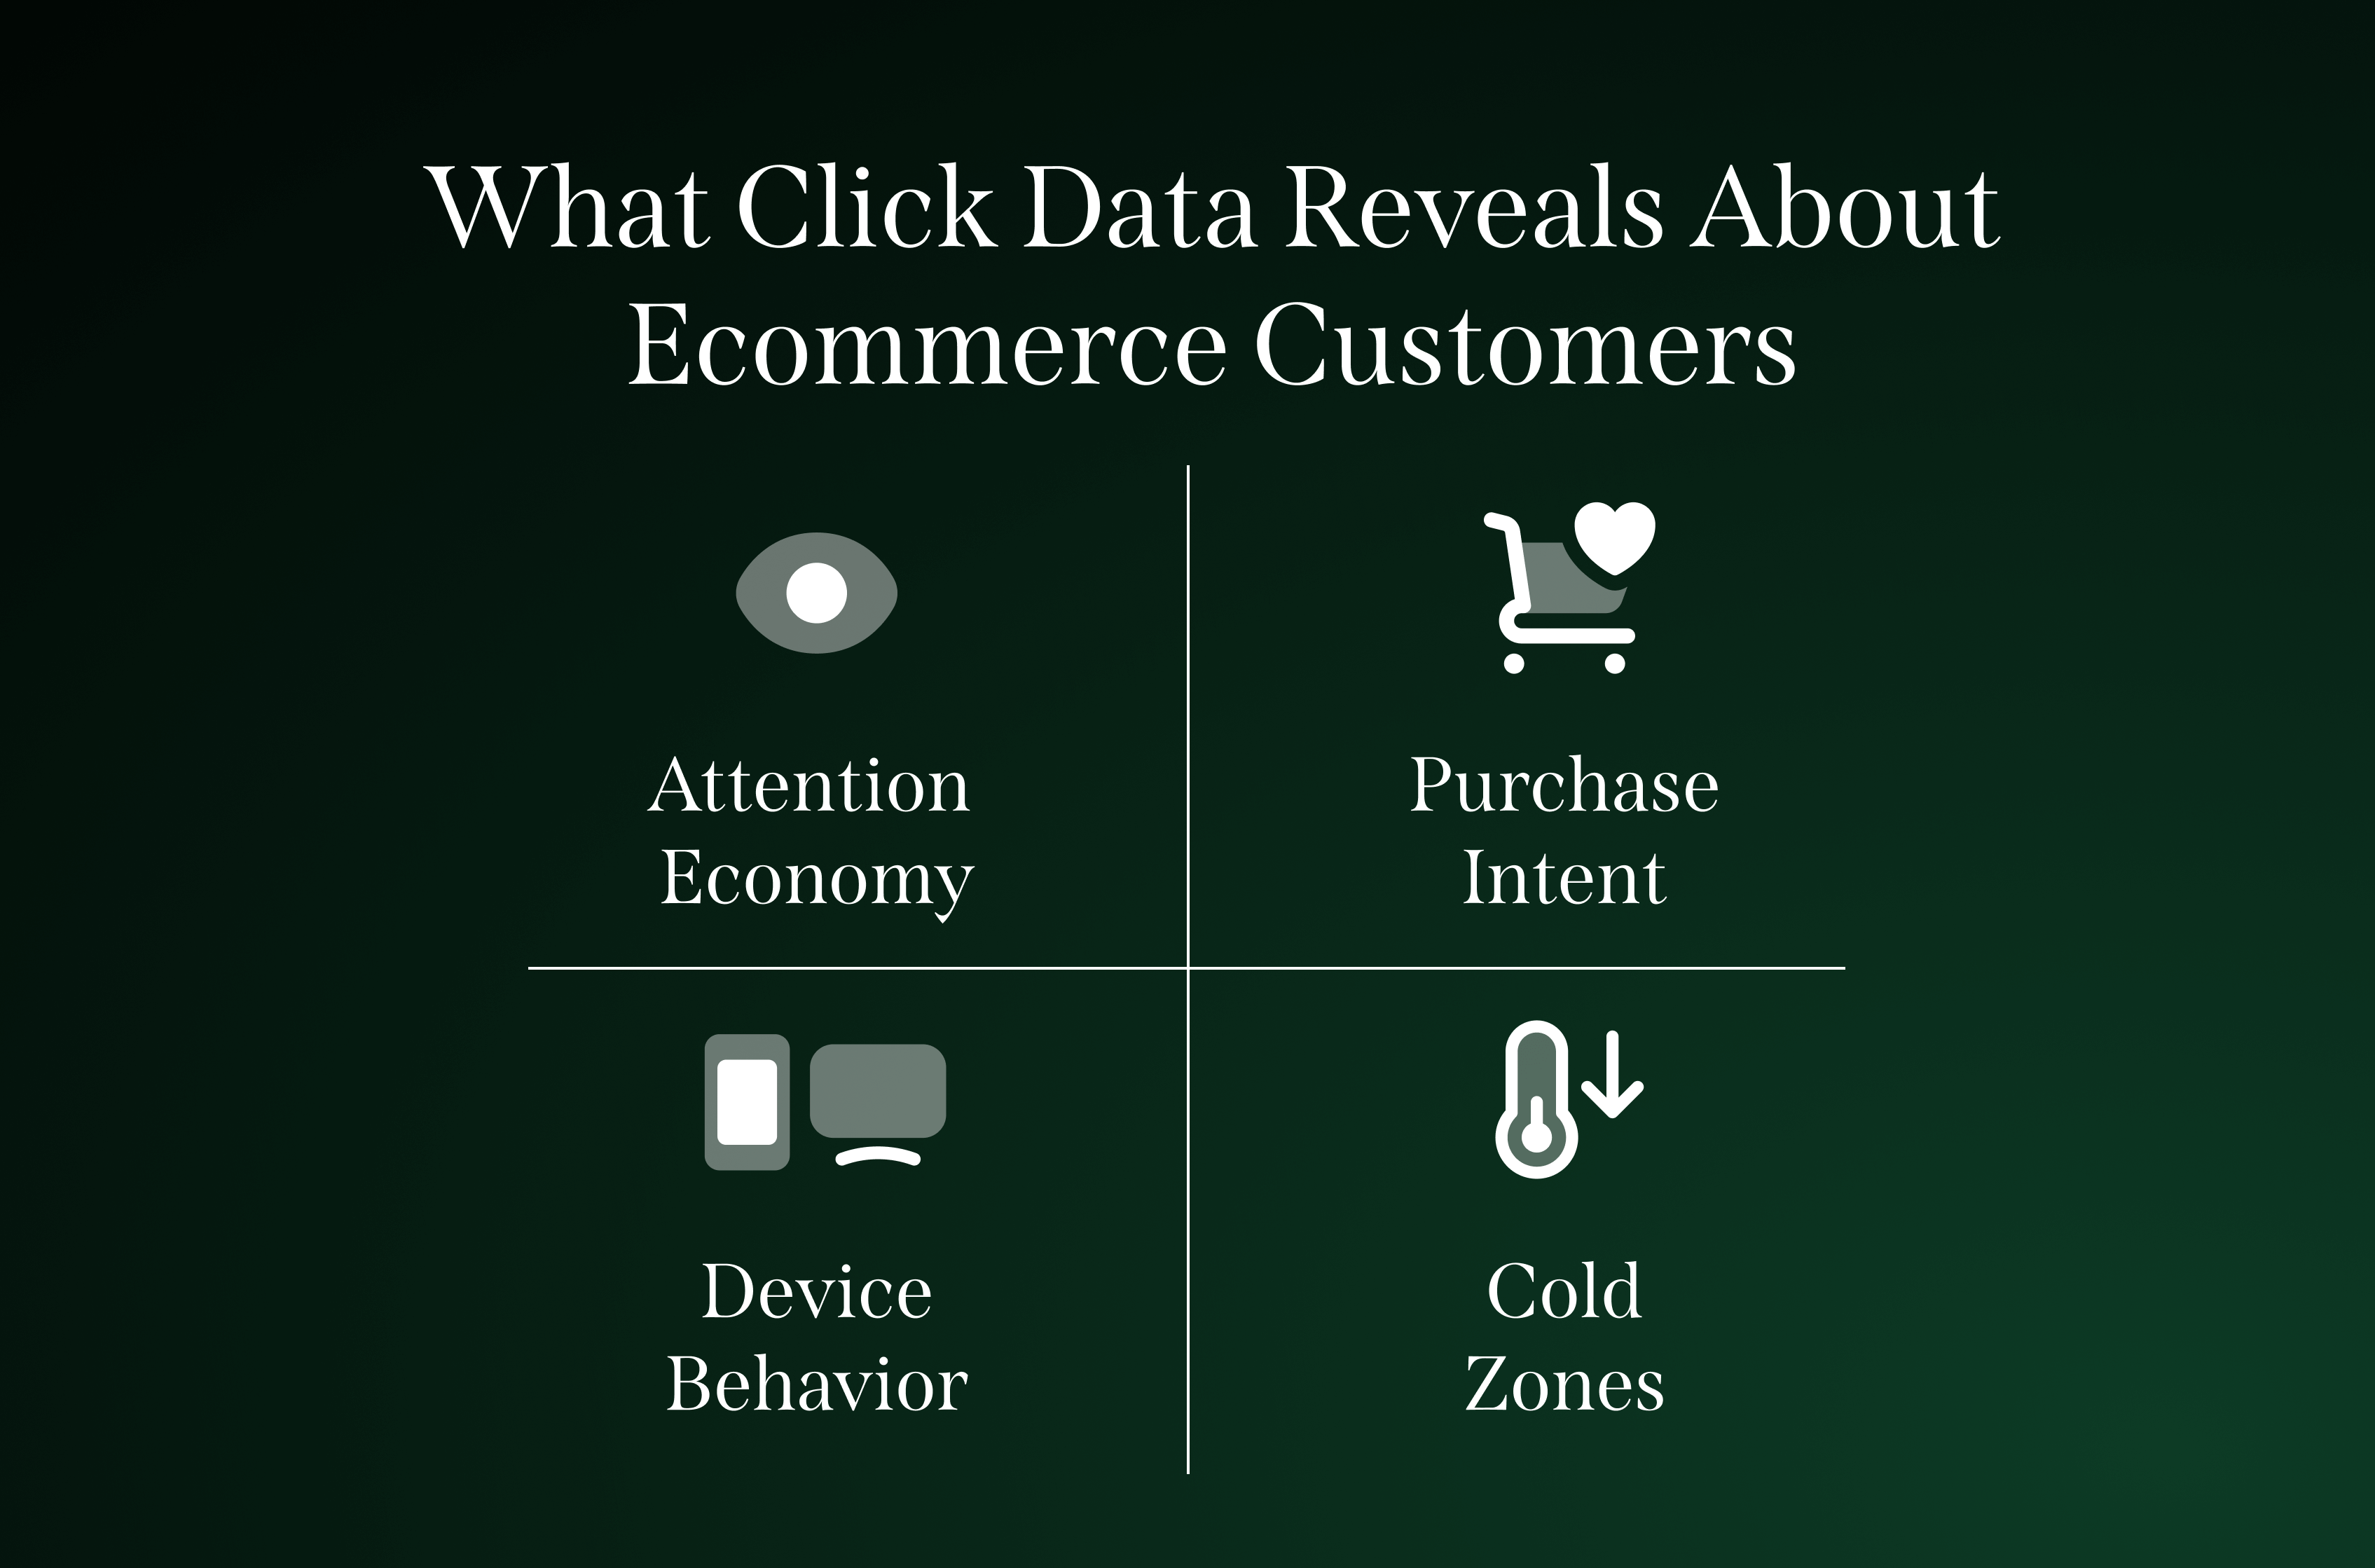
The four key insights click data provide about ecommerce customer behavior
Here's what click data can uncover about shopper behavior:
The Attention Economy in Action: Click patterns reveal which elements truly capture attention versus those that are simply seen. A product module might be visible above the fold, but if it's not generating clicks, it may not be generating interest. Click data shows you the difference between visibility and engagement.
The Path to Purchase: Every click tells a story about customer intent. High-click areas on product images suggest strong visual appeal. Clicks on pricing information indicate price-conscious shoppers. Clicks on reviews and testimonials reveal trust-building moments. Understanding these patterns helps you optimize the entire customer journey.
The Mobile vs. Desktop Divide: Click behavior varies dramatically between devices. What works on desktop might fail on mobile, and vice versa. Click data reveals these device-specific patterns, allowing you to create truly responsive experiences that convert across all touchpoints.
The Cold Zone Problem: Perhaps most importantly, click data reveals the "cold zones" — areas of your funnel that receive little to no interaction. These dead spaces represent missed opportunities and potential friction points that could be optimized or eliminated entirely.
Enter the Game-Changer: Visual Click Intelligence
This is where FERMÀT's advanced heatmap technology transforms the optimization game. Unlike traditional analytics that show you what happened, FERMÀT's visual click intelligence shows you where it happened, when it happened, and most importantly, why it matters.
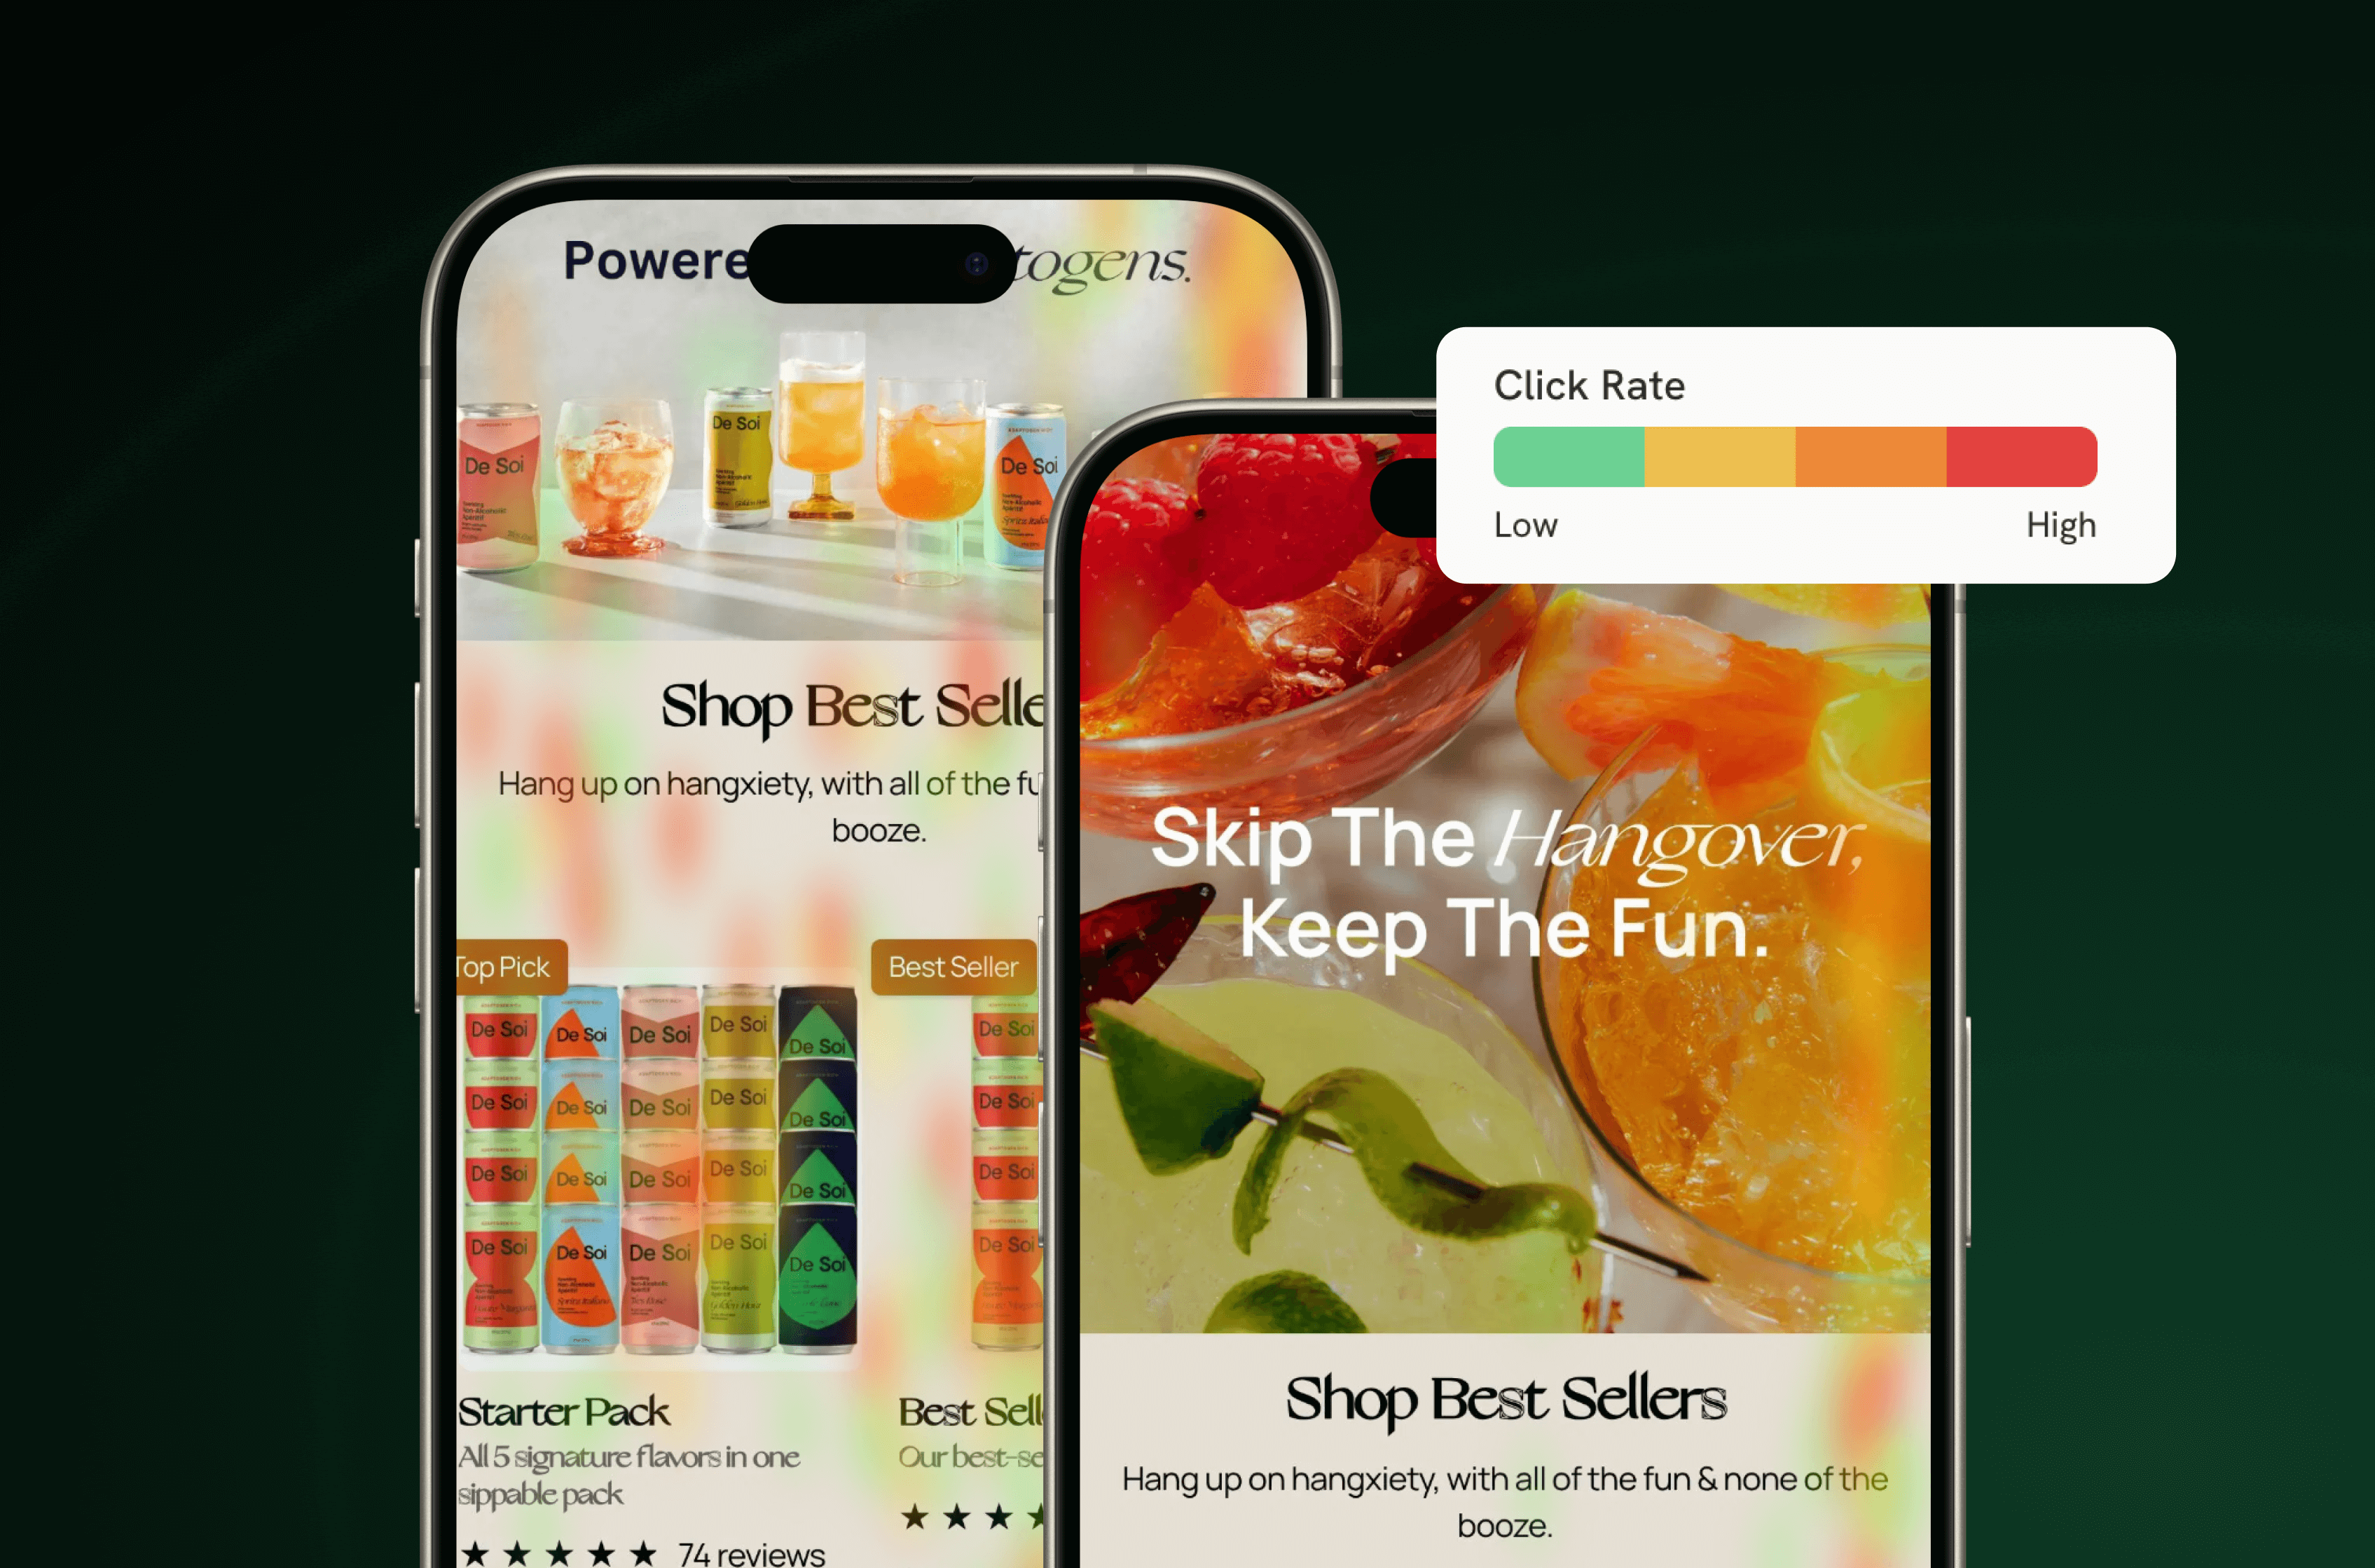
FERMÀT's heatmap system uses an intuitive color-coding approach that makes complex data instantly actionable:
- Red/Orange zones indicate high-click activity—these are your conversion hotspots
- Green/Blue zones show low-click areas—potential optimization opportunities
- Cold zones reveal completely ignored elements that might need repositioning or removal
FERMÀT's intuitive heatmap interface showing click intensity across funnel pages with clear color-coded insights
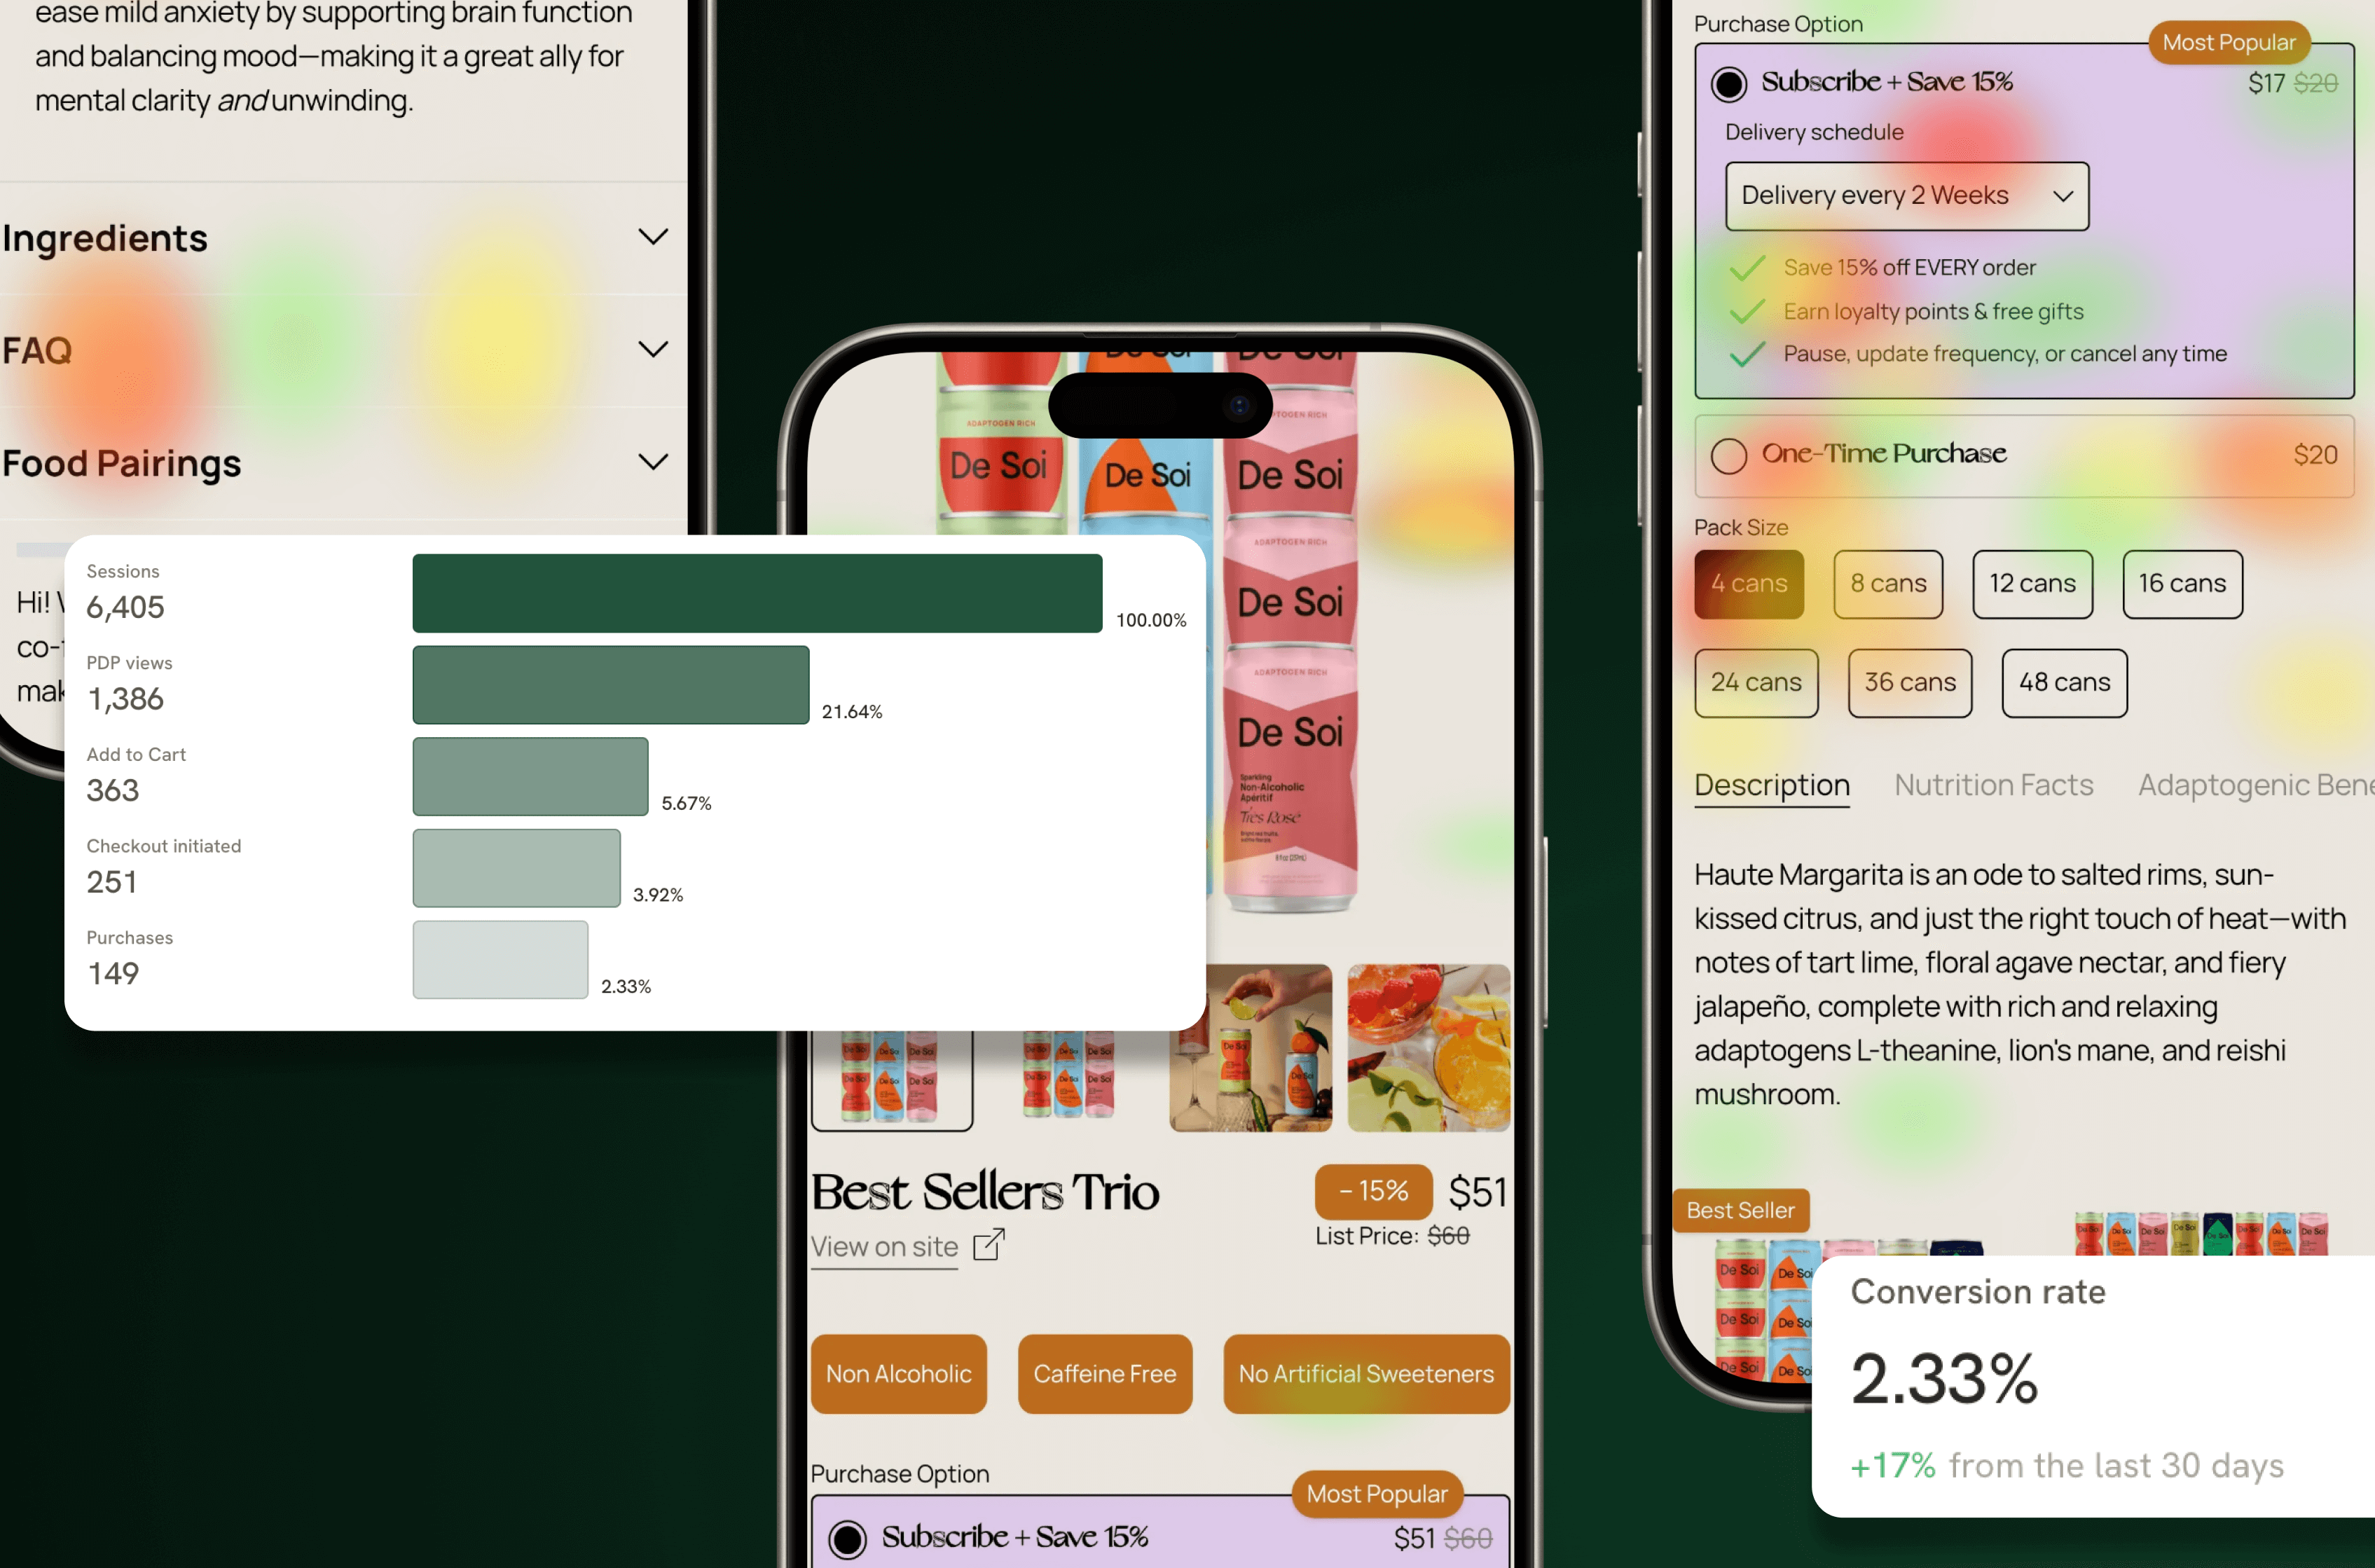
But here's where it gets revolutionary: FERMÀT has just launched heatmaps for Product Detail Pages (PDPs), giving you unprecedented insight into how customers interact with your most critical conversion pages.
This isn't just another analytics dashboard, it's a window into your customers' minds. You can see exactly which product images generate the most interest, which CTAs drive action, and which elements are being completely ignored. The dropdown functionality allows you to switch between different products and pages, giving you a comprehensive view of performance across your entire catalog.
The PDP Optimization Goldmine
Product Detail Pages are where browsers become buyers, or where they abandon ship. With FERMÀT's PDP heatmaps, you can finally see the micro-interactions that drive macro-conversions on these critical pages.
The Add-to-Cart Moment: The heatmap reveals exactly how customers interact with your primary CTA. Is the "Add to Bag" button getting the attention it deserves? Are customers clicking on it multiple times, suggesting a technical issue? Or are they ignoring it entirely, indicating a design or positioning problem?
Product Image Engagement: Visual content drives ecommerce decisions, but which images actually capture attention? FERMÀT's heatmaps show you which product shots generate clicks, which angles resonate with customers, and which images might be redundant or ineffective.
Information Hierarchy: PDPs contain multiple information layers, pricing, descriptions, reviews, specifications. Click data reveals which information customers prioritize, helping you restructure your pages for maximum impact.
Trust Signal Performance: Reviews, ratings, and social proof elements are crucial for conversion, but are customers actually engaging with them? Heatmaps show you which trust signals work and which need optimization.
The Competitive Advantage of Click Intelligence
While your competitors are still guessing what works, you'll have definitive data about customer behavior. This isn't just about improving conversion rates, it's about understanding your customers at a deeper level.
Click data reveals customer preferences, pain points, and decision-making patterns that traditional analytics miss. It shows you not just what customers do, but how they think. This intelligence becomes the foundation for:
- More effective product positioning
- Better user experience design
- Smarter inventory and merchandising decisions
- More targeted marketing campaigns
- Improved customer satisfaction and retention
The brands that master click data analysis won't just optimize their current funnels, they'll build better products, create more compelling experiences, and develop deeper customer relationships.
Your Next Move: From Guesswork to Growth
The difference between successful ecommerce brands and struggling ones isn't just traffic or product quality, it's the ability to understand and act on customer behavior. Click data analysis transforms optimization from an art into a science. FERMÀT's heatmap technology, especially the new PDP functionality, gives you unprecedented visibility into customer interactions. You can see exactly what's working, what's not, and most importantly, what to do about it.
But here's the thing: insights without action are worthless. The brands that will dominate tomorrow's ecommerce landscape are the ones taking action today. Here's your optimization framework for transforming click data insights into conversion-boosting results:
The five-step optimization framework for turning click data into conversion improvements
1. Optimize Your High-Impact Zones
What to look for: Red and orange hotspots indicate high-engagement areas, your conversion goldmines.Quick wins: Amplify successful elements by making them more prominent, test variations of high-performing CTAs, and replicate successful design principles to underperforming areas.
2. Revive Your Cold Zones
What to look for: Blue areas or complete cold zones represent missed opportunities.Quick wins: Relocate important elements to higher-engagement areas, enhance visual appeal with better design or copy, or remove unnecessary elements that add clutter without value.
3. Mobile-First Optimization
What to look for: Different click patterns between desktop and mobile views.Quick wins: Ensure high-click elements are thumb-friendly, simplify mobile navigation, and optimize touch target sizes for mobile interaction.
4. CTA Optimization Framework
What to look for: Click intensity around your primary and secondary calls-to-action.Quick wins: Move high-performing CTAs to more prominent locations, use colors that generate high click activity, and place primary CTAs in multiple high-click zones.
5. Product Module Performance
What to look for: Engagement patterns across different product modules and categories.Quick wins: Reorder modules by performance, apply design elements from high-performing modules to underperforming ones, and analyze what makes certain modules more engaging.
The click data revolution isn't coming, it's here. Your customers are already telling you exactly what they want. FERMÀT's heatmaps help you listen.